 Catalogo de metadatos del IGME
Mapa digital: JPEG -Joint Photographic Group Format
Type of resources
Available actions
Topics
Provided by
Years
Formats
Representation types
Update frequencies
status
Scale
-
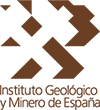
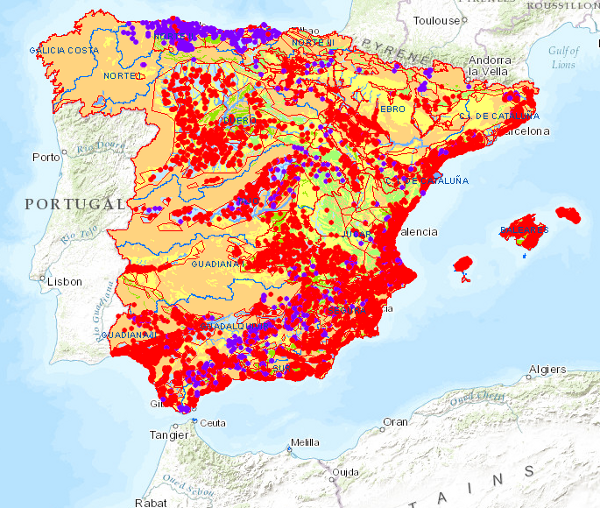
The continuous Hydrogeological Map of Spain in digital format at a scale of 1:200,000 is based on the Lithostratigraphic and Permeability Map of Spain, continuous at a scale of 1:200,000 and represents the mapped lithostratigraphic levels, grouped by range of permeability and the associated lithologies, and represented with a certain colour and tone, so that it is possible to visualise the areas associated with the different aquifers on the map. Blue colours represent porous aquifers, green colours represent fissured or karstic aquifers and brown colours represent impermeable or low permeability formations. Productivity is represented by the tone, in the case of permeable formations, dark tones indicate greater productivity and in the case of impermeable formations indicate greater impermeability. For the preparation of the Hydrogeological Map, once it had been verified that the formations that make up the main aquifers were cartographically differentiated on the Lithostratigraphic and Permeability Map of Spain, a hydrogeological legend was drawn up, grouping them according to their permeability, geometry, hydraulic relationship and hydrogeological functioning. This work was carried out taking into account the existing information on the different aquifers in Spain as well as the groundwater bodies defined in accordance with the Water Framework Directive (WFD). The continuous Hydrogeological Map of Spain in digital format at a scale of 1:200,000,000 arises from the need for a continuous map of the entire national territory on which to capture the information and distribution of the groundwater bodies (m.a.s). This cartography is adapted to the hydrographic network and the shadow model made by CEDEX, at a scale of 1:20,000, from the topographic base, at a scale of 1:50,000, of the Army Cartographic Service. The cartographic information is referenced to coordinates in UTM projection, European Datum, zone 30, except for the Canary Islands, which is referenced to zone 28. The Hydrogeological Map is made up of a polygonal layer of cartographic units (LPLIT) and the external tables Hidro.dat and Descrip_hidro.dat. The format of the information generated is Shape file.
-
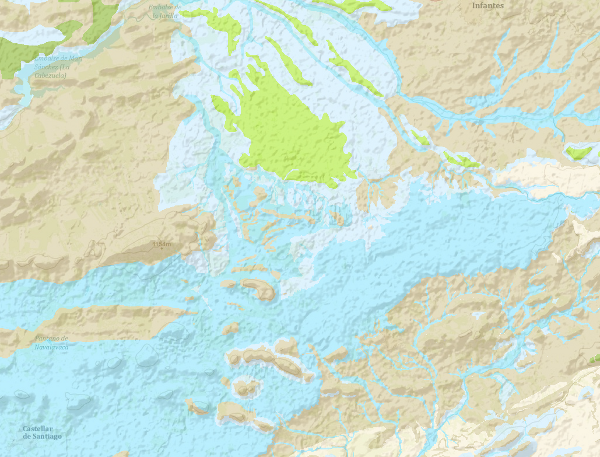
The continuous lithostratigraphic map of Spain in digital format at a scale of 1:200,000 represents the cartographic units characterised mainly according to lithostratigraphic and hydrogeological criteria. The criteria maintained to consider their cartographic representation are to maintain those units that present an important lithostratigraphic development, both for their representation and their singularity, also incorporating those that show a high hydrogeological interest, either because of their lithological nature (high permeability) or because they are considered to form an essential part of the definition of the aquifer. The contacts between the cartographic units represented were normal, unconformable and intrusive contacts. Faults, thrusts and folding structures are represented. Thus, a continuous map has been obtained in digital format, in which there are still areas with a higher density of cartographic information than others, either because they come from synthesis maps made with less general criteria than these, or because for their preparation, smaller scale cartographies (e.g. 1:50,000) have been used, thus obtaining a much richer and more detailed cartography. This map is the basis of the permeability and hydrogeological maps of Spain at a scale of 1:200,000 continuous and in digital format. This cartography is adapted to the hydrographic network and the shadow model made by CEDEX, at a scale of 1:200,000, from the topographic base, at a scale of 1:50,000, of the Army Cartographic Service. The cartographic information is referenced to coordinates in UTM projection, European Datum, zone 30, except for that corresponding to the Canary Islands, which is referenced to zone 28. The map is made up of the following information layers: Cartographic Units (LPLIT), Contacts and Fractures (LPCYF) and Folding Structures (LPEST). The format of the information generated is Shape file.
-
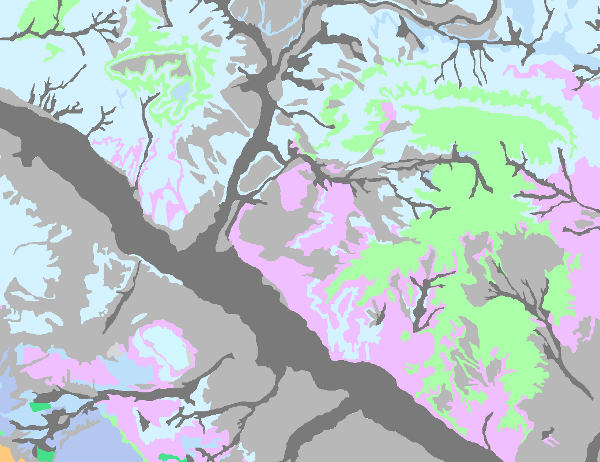
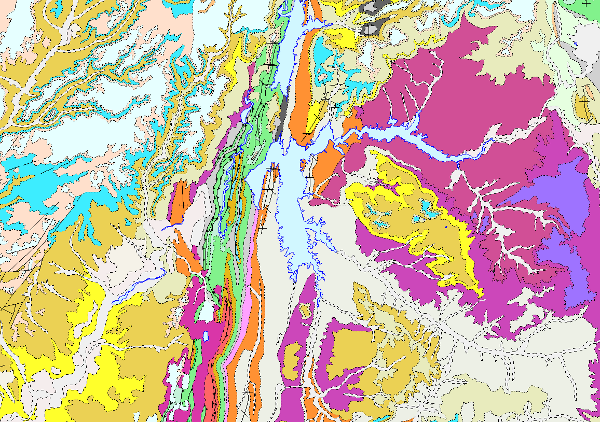
The continuous and digital Permeability Map of Spain at a scale of 1:200.000000 is based on the continuous Lithostratigraphic Map of Spain at a scale of 1:200.000 and represents the mapped lithostratigraphic levels grouped by similar permeability values. In order to carry it out, firstly, a legend was drawn up in which a degree of permeability was assigned to each mapped lithostratigraphic unit. Five types of permeability were established: Very high, High, Medium, Low and Very low. The different lithologies were associated into 7 large groups (carbonate, detrital, Quaternary detrital, volcanic, metadetritic, igneous and evaporitic), giving rise to a classification by types of aquifers, established according to the formation processes of each permeability. This map clearly shows the hydrogeological domains with a predominance of calcareous and evaporitic, detritic and crystalline aquifers, highlighting the main peninsular and island structural lines that bring the different groundwater bodies defined into contact with each other. This cartography is adapted to the hydrographic network and the shadow model produced by CEDEX, at a scale of 1:200,000, based on the topographic base, at a scale of 1:50,000, of the Army Cartographic Service. The cartographic information is referenced to coordinates in UTM projection, European Datum, zone 30, except for that corresponding to the Canary Islands, which is referenced to zone 28. The map is made up of the Cartographic Units Information Layer (LPIT) and the external table dat table, which assigns to each lithostratigraphic formation (FH) the degree of permeability as well as the colour of representation. The format of the generated information is Shape file.
-
The Permeability Map of Spain at a scale of 1:1,000,000 is the Hydrogeological Map of Spain at a scale of 1:1,000,000, classified according to permeability. Permeability is represented by colours, while lithostratigraphy or hydrogeology is represented by symbolisation of the materials. It is a synthesis of the permeable hydrogeological formations and aquifers at national level, resulting from the systematic studies carried out by the IGME until 1991 on the hydrogeological characteristics of the territory of Spain, determining the location of the aquifers, evaluating their degree of exploitation, hydrodynamic characteristics, resources and reserves, and the quality and contamination of their waters. The map has been drawn up by the Geological Survey of Spain in compliance with its specific functions. It covers the national territory of the Iberian Peninsula, the Balearic Islands and the Canary Islands. The first edition of the Hydrogeological Map of Spain at a scale of 1:1,000,000 corresponds to 1991. A second edition was produced in 1999, incorporating the Hydrogeological Units of Spain into the hydrogeological map.
-
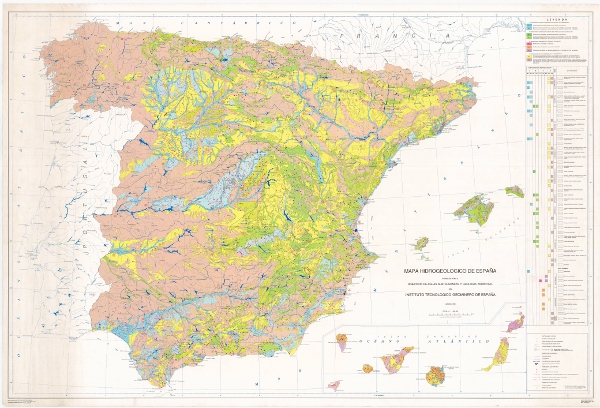
The Hydrogeological Map of Spain at a scale of 1:1,000,000 presents the geological units classified according to their hydrogeological character, based on the surface permeability of the outcrops. The hydrogeology is represented by symbolisation of the materials. It is a synthesis of the permeable hydrogeological formations and aquifers at national level, resulting from the systematic studies carried out by the IGME until 1991 on the hydrogeological characteristics of the territory of Spain, determining the location of the aquifers, evaluating their degree of exploitation, hydrodynamic characteristics, resources and reserves, and the quality and contamination of their waters. The map has been drawn up by the Geological and Mining Institute of Spain in compliance with its specific functions. It covers the national territory of the Iberian Peninsula, the Balearic Islands and the Canary Islands. The first edition of the Hydrogeological Map of Spain at a scale of 1:1,000,000 corresponds to 1991. A second edition was produced in 1999, incorporating the Hydrogeological Units of Spain into the hydrogeological map.
-
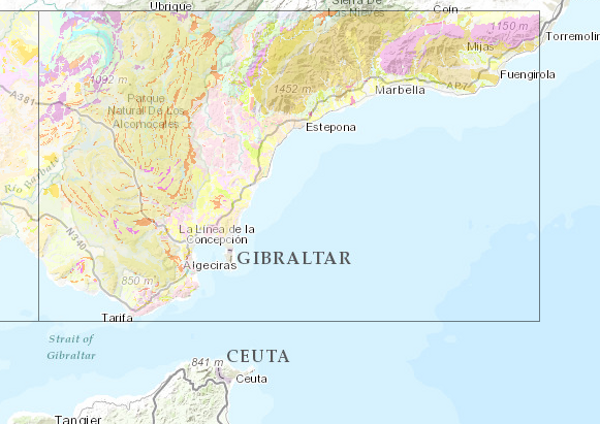
This Map depicts the materials or rocks that appear on the surface of the sheet, their spatial distribution, nature and geometric relationships. The cartographic units are chronostratigraphic groupings, with common lithology and age formed by strata which are called formations, groups or members; other non-stratified ones such as granites are represented. The structural relationships between them are expressed by symbols, which gives the map a three-dimensional character completed by additional geological profiles. These are the graphic expression of the deep geometrical arrangement of the units shown on the geological map. Applied information such as water points, mineral deposits and indications, presence of fossils and other elements of point representation are added by means of symbology. The printed sheets include geological sections, columns of the main zones or units and various diagrams (regional geological and tectonic diagrams, both at a scale of 1:1,000,000). The nominal scale of the series is 1:200,000, but in the island territories it has been produced at a scale of 1:100,000. The digital information, geological map 1:200,000, chronolithostratigraphic legend and legend of geological symbols, is stored in coverage format (ESRI). There is a guide reflecting its organisation and codification. The IGME is responsible for the execution of this series of cartography, which it finances with its own resources. The creation of this cartography is based on the compilation of existing information, mainly MAGA cartography at a scale of 1:50,000, doctoral theses and other research work.